WhatIF Earnings
So you think Netflix will beat EPS expectations because of the demand for its content but you have no idea what to expect from the stock? Enter WhatIF Earnings!
Data is an essential ingredient in any investment process. But when does an observed relationship - correlation, pattern, mean reversion - become a tradable insight?
In a portfolio that consists of thousands of small trades, with frequent buys and sells, statistical confidence may be all that’s required.
Machines are in a league of their own when it comes to processing large amounts of information. They can look through mountains of data, easily outpacing an army of human analysts. The rigor and uniformity of the process ensures that whatever they uncover meets predetermined standards of statistical confidence.
But for a typical discretionary portfolio, that’s not enough. Many non-professional investors have at most 15 trades in their portfolios, and half of them have even fewer than that. For those investors, a statistically significant relationship isn’t sufficient to pull the trigger. There are a lot of other factors to be considered.
So do machines warrant a place in a discretionary investment process?
TOGGLE’s AI sifts through billions of data points, leaving no stone unturned in the quest to uncover new patterns and relationships. But is a statistically solid, logically sound relationship - if A, then B (90% of the time) - all that an investor needs to know before placing a new trade?
At TOGGLE, after a pattern has been identified - strong momentum in stock A typically leads to market outperformance over the following X months - the relationship is tested for a range of other criteria. The goal is to distill machine-generated findings down to those that satisfy the most intuitive checks a discretionary investor will typically perform.
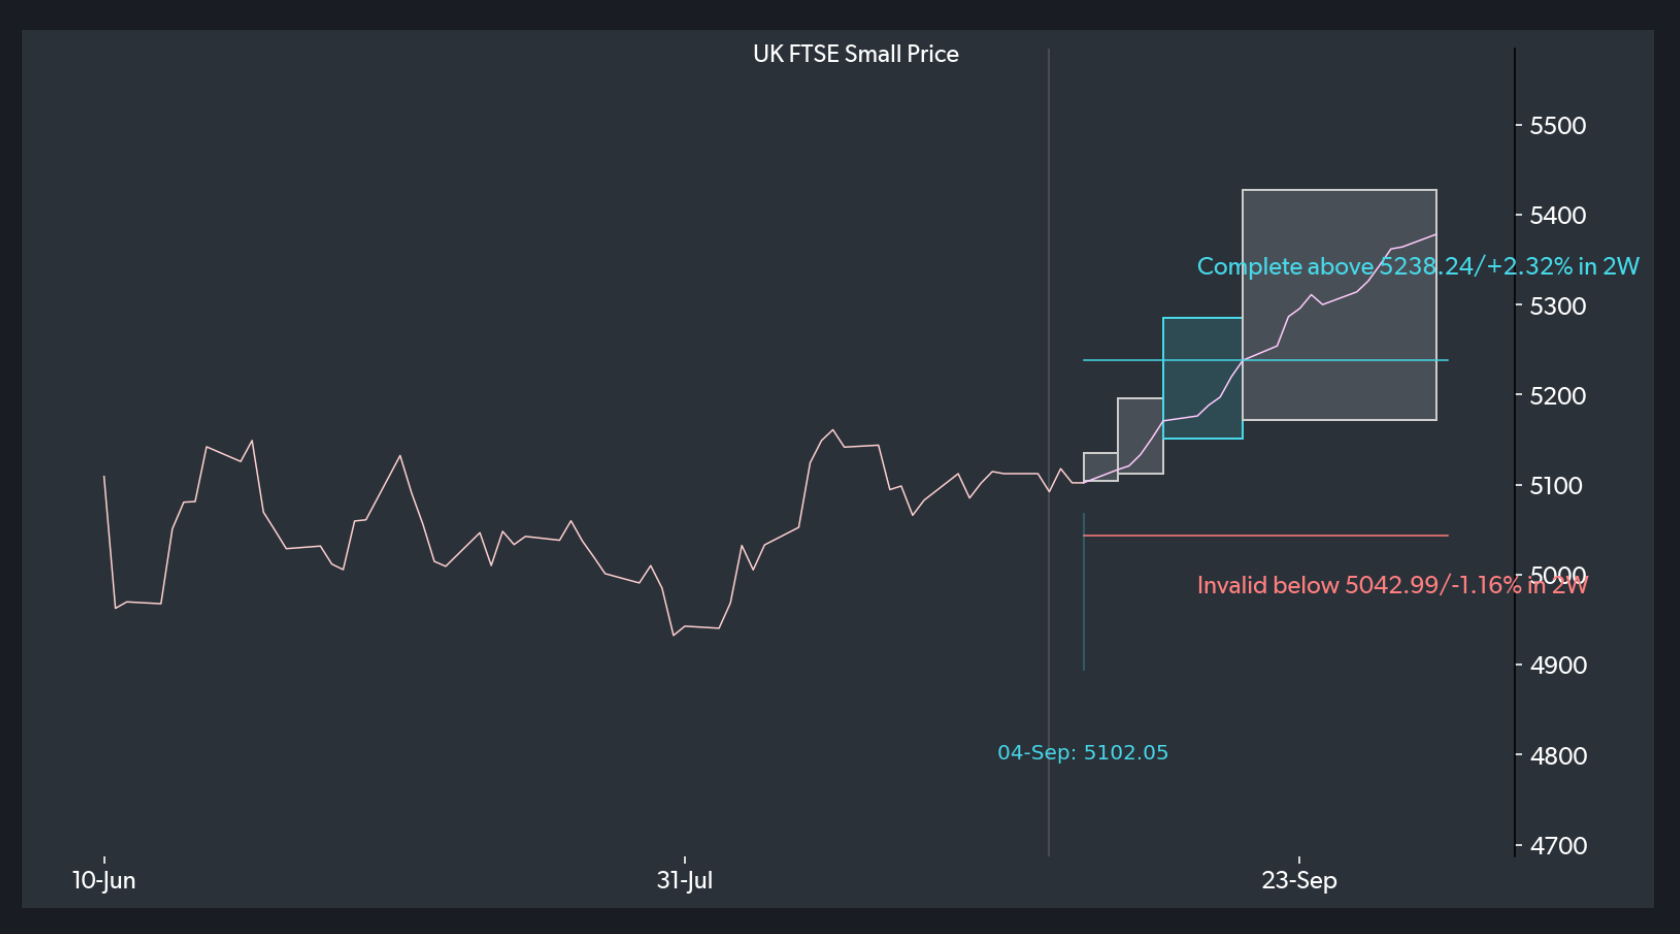
Discretionary investors rely on analogical inference… “have I seen something like this before? If so, what happened?” They judge the environment through the lens of their own investing experiences. When they identify a familiar sequence of events, they act based on how consistently that sequence of events previously led to a certain move in the asset price.
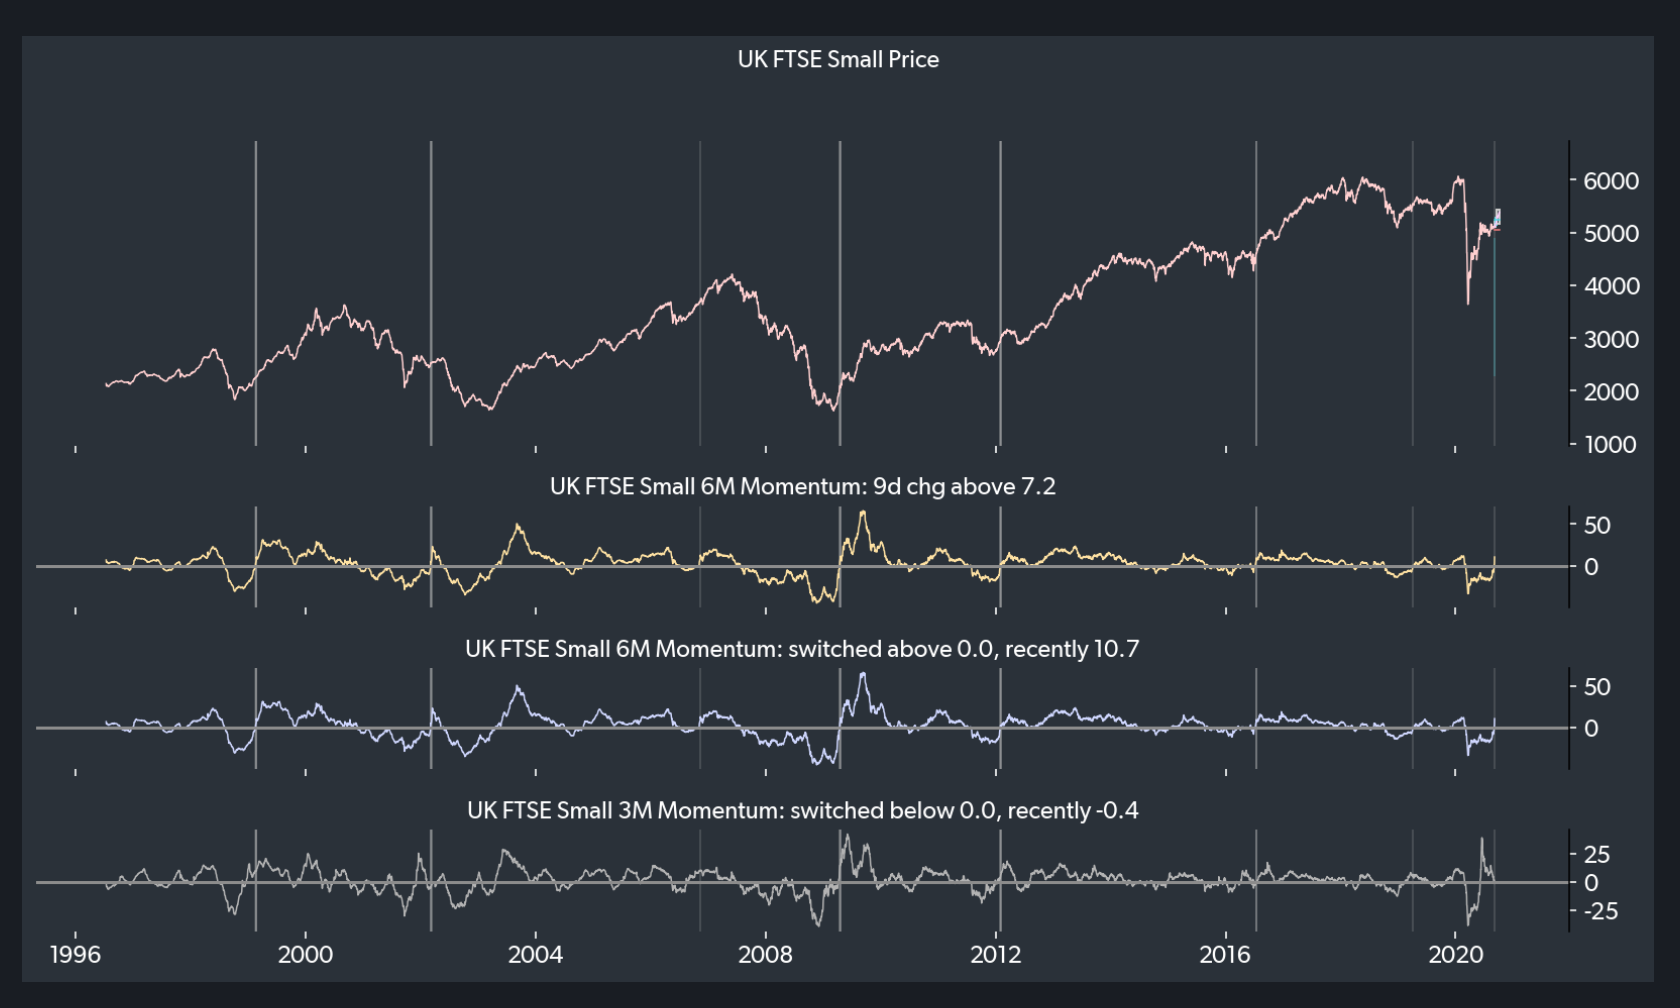
TOGGLE thinks in very similar terms. It starts the analysis by checking the first metric a human analyst would likely look at, accuracy: how often did the relationship produce the expected result, i.e. when A happened, how often did B occur afterwards?
TOGGLE AI performs both an in-sample as well as out-of-sample test. An in-sample test considers “how frequently was this right, historically”. An out-of-sample test is a little more involved. Let’s say a relationship was observed 8 times in the past. TOGGLE initially restricts itself to the first 3 times to make a prediction about the 4th occurrence, and checks it against the actual outcome. Then it repeats this for the 5th occurrence, using only the first four ... and so on and so forth. Approaching the test in this manner means that the predictive power of the relationship is more robust,. You haven’t biased it with information that wasn’t known at the time.
At the heart of every investment process is the consideration of how much a trade might make (return) versus the risk it might entail. Risk comes in many forms, but in most cases investors focus on two: what are the chances I am wrong? If I am right, how bumpy is the path?
The latter is important because, even if a thesis ultimately proves correct, a very volatile path will be a challenge and might lead the investor to sell at the wrong time because they can’t take the pain of negative P&L. In portfolio management, the metric that tries to capture this is the Drawdown ratio (sometimes called the Calmar ratio).
TOGGLE helps investors assess whether a pattern is compelling enough to justify a trade by 1) measuring historical outliers - how much would you have lost when the thesis didn’t play out, and 2) what was the distribution of returns along the way - how painful was the asset’s path.
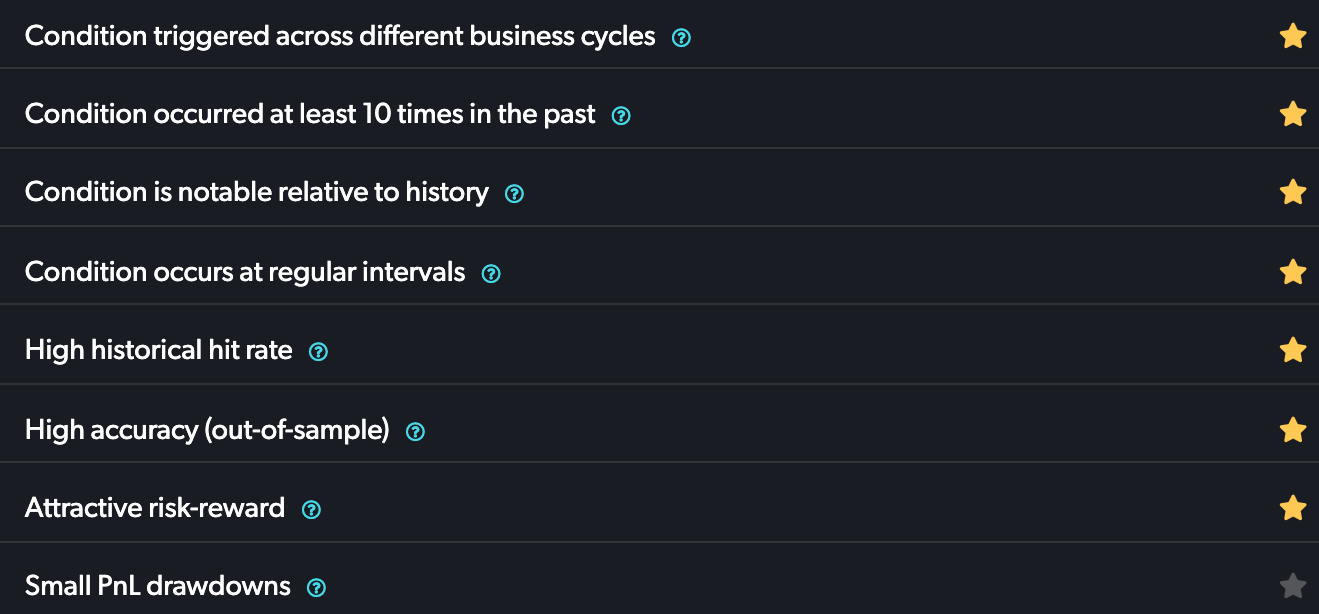
Another important question is “does the relationship only hold during specific periods?” (during a financial crisis, Fed tightening cycle etc.) TOGGLE tests to make sure that the relationship has been robust across business cycles, and therefore isn’t beholden to any particular environment.
Another desirable characteristic of a trade is regularity. If a pattern occurs with some regularity (say, every few months) there is less worry that an unknown systemic variable might be causing a relationship, like during a specific market environment (e.g. the Great Financial Crisis).
A solid insight doesn’t need to satisfy all of these criteria...but the more criteria it satisfies, the more compelling it is, and the more compelling it is for investors to include the insight in their decision making framework.
Discretionary investors usually seek to deploy ideas that score as high as possible along similar measures of “desirability”.
At TOGGLE, we espouse this approach and have created a concise rating that allows users to gauge the idea in this framework. All ideas gain a “star” ranking with the best ones reaching a full rank of 8 stars.
Turning Data into Insights


