
Dec 12
preview

“When price action is particularly damaging to the P&L, how do you distinguish between a great opportunity to add, and the last chance to get out before it gets worse?”
A fundamentally-driven investor is routinely confronted with both strategic and tactical decisions. Whether macro or micro, estimating target price levels is part of the former. This estimate is typically a function of “fair value”, determined by forecasting a number of underlying variables. This target is an important North Star that guides the initial decision to invest, or not.
However, this longer-term view doesn’t often help with the tactical decision making on the battlefield of daily price changes and information overload. Markets are wont to test the mettle of a strategic view every day with a barrage of news, changing data, and volatile prices.
Except the fortunate few with truly long term horizons (10+ years), most investors are path dependent in their ability to stick with positions, often due to their own liquidity constraints or an external (and loss-intolerant) investor base.
When price action is particularly damaging to P&L, how do you distinguish between a great opportunity to add, and the last chance to get out before it gets worse? When do you abandon your strategic view and change direction?
TOGGLE was built with such an active investor in mind. Once the system has crunched through billions of data points and assembled the mosaic of likely drivers for the analyzed asset, it provides the most likely path. In fact, it goes a step further: it provides a confidence band constructed by analyzing similar periods in the past.
In the example below, TOGGLE highlights that the Spanish IBEX index might be poised to recover some of the losses. Each of the boxes represents a 1 month period, and the height of each box is the corresponding 1 standard deviation confidence band.
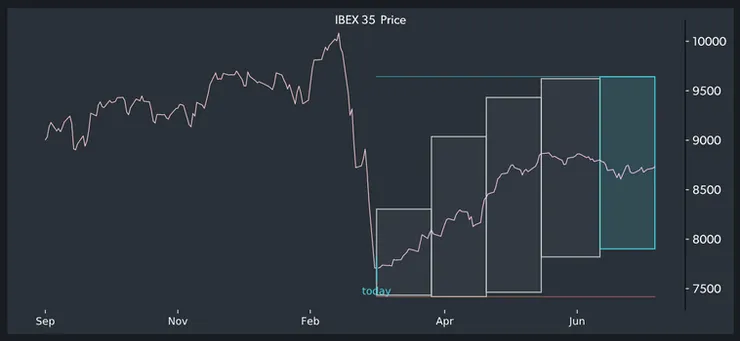
For an investor looking to buy Spanish equities, a logical stop-loss is below the bottom of the 1-month band, a loss of almost 4%. That must be weighed against a potential 25% gain if the scenario reaches the upper band of the likely outcomes.
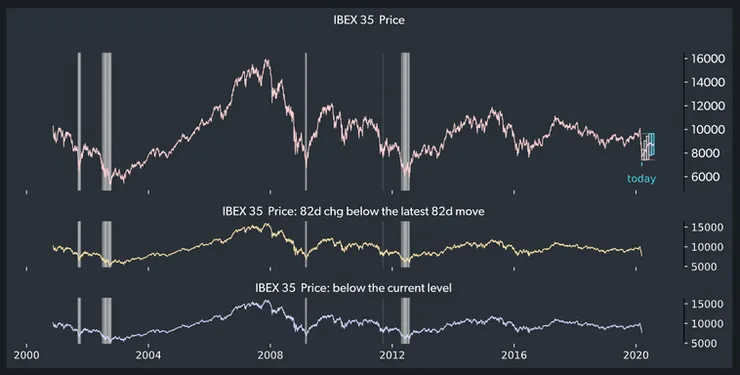
But how confident can they be that the data behind the analysis is an accurate guide? The episodes TOGGLE identified as most similar to the current situation are highlighted in the longer-horizon chart, giving the analyst an idea whether the representative sample may in any way be a flawed comparison to present-day analysis.
The Art of Catching a Falling Knife


Up Next
Dec 12
preview