
Dec 12
preview

With global bond yields near all-time lows, investors and institutions with Risk Parity portfolios may wonder whether the approach will be effective moving forward. Do these portfolios still make sense, or was the wildly popular strategy of allocating capital based on risk merely a lucky bet on the 40-year bull market in bonds?
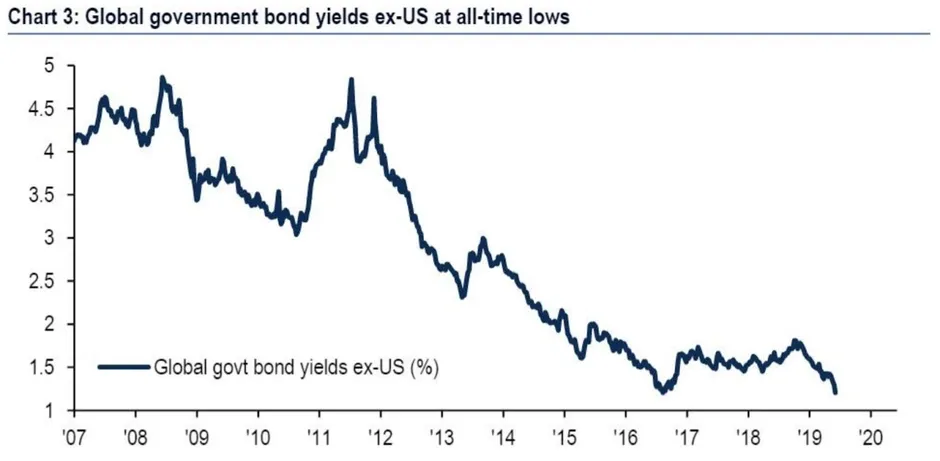
Source: BofA Merrill Lunch Global Investment Strategy, Haver. Note chart shows equal weighted bond yields for Japan, China, UK, France, Italy, Germany, Canada, Spain, Australia, Belgium, Netherlands, Austria, Poland, Portugal, Israel, Russia, Malaysia, Sweden, Ireland
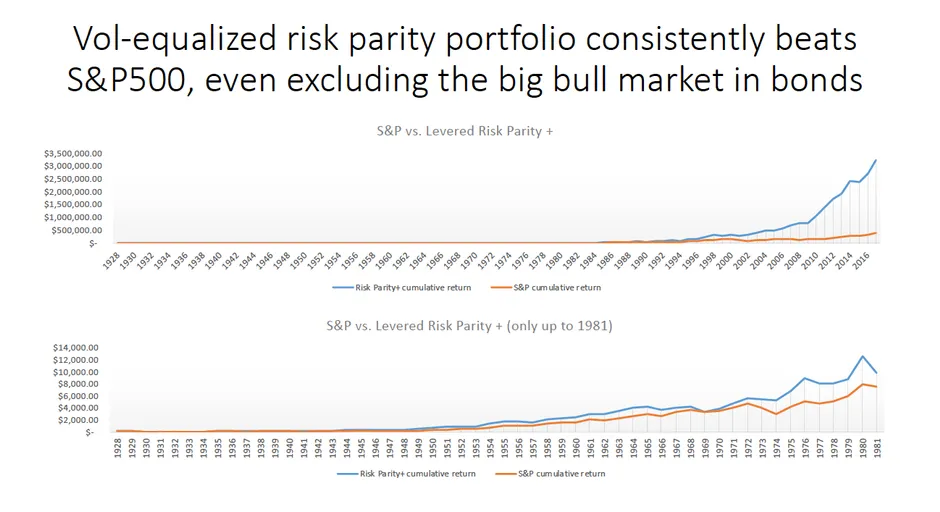
Even in this low interest rate environment our stress-tests show that, on a risk-adjusted basis, Risk Parity outperforms a simple investment in the S&P 500.
The first chart below shows the relative performance of a Risk Parity portfolio vs. a long-only S&P allocation from 1928 onward. You quickly see that Risk Parity outperforms handily. But, what if we were to exclude the bull market in bonds? The second chart illustrates exactly that point. It starts at the same time but ends in 1981, the start of the bond bull market. Even here, we see that Risk Parity outperforms.
Source: TOGGLE
Why might this be? As we’ll see, it is largely due to the dynamics during fixed-income bear markets: the size of the coupon payments earned by owning bonds typically swamps whatever moves in yield occur.
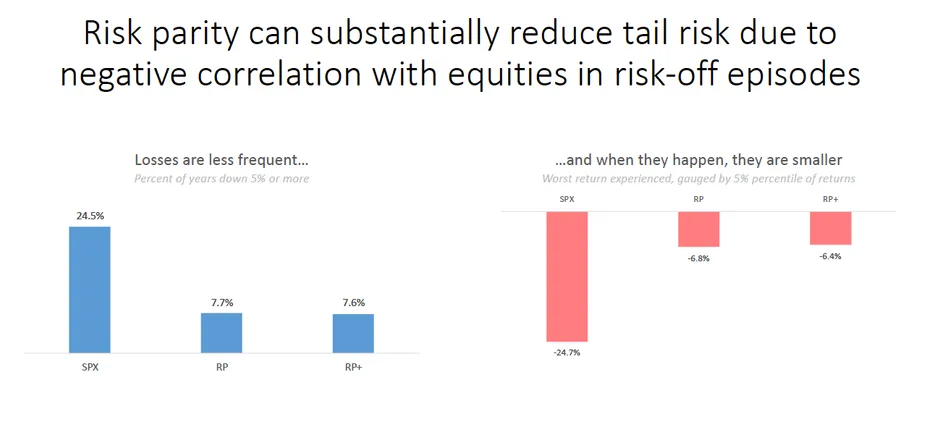
Although the outperformance is less stark excluding the bull market period, a Risk Parity portfolio’s substantially better drawdown characteristics make it a desirable allocation for endowments or pension funds.
Source: TOGGLE
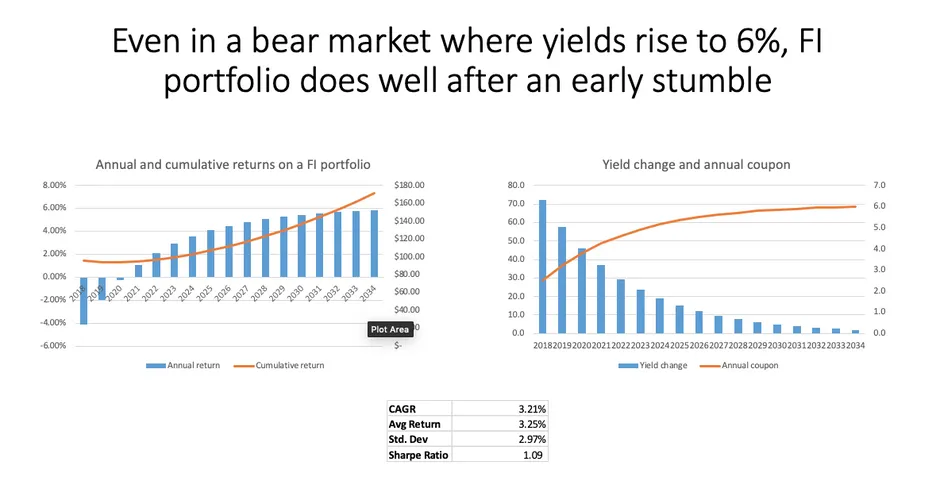
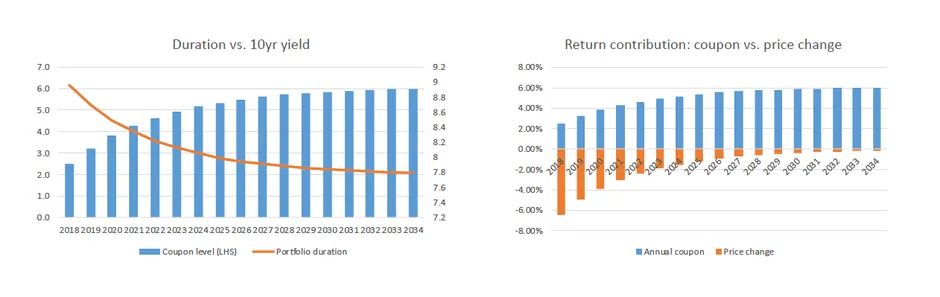
In order to better visualize the forces impacting a Risk Parity portfolio, we simulated a harsh bear market in bonds by assuming sharp increases in yields, tapering off until the US 10Y reaches 6% (RHS, below). Under this scenario, a Risk Portfolio suffers in the first couple of years but quickly regains its footing (LHS, below).
Source: TOGGLE
In addition to the ever-larger carry due to higher yields, Risk Parity portfolios also benefit from rapidly falling duration during fixed-income bear markets. This effect mitigates the impact of rising yields in later years and helps lead Risk Parity back into the black after the first three bear market years.
Source: TOGGLE
In conclusion, although we are currently at the zero bound for global bond yields and immediate yield rises could prove challenging for Risk Parity strategies, they still remain a solid choice for many portfolios.
Risk Parity Portfolios at the Zero Bound


Up Next
Dec 12
preview