
Dec 12
preview

Election Day is looming large in investors’ minds. Historically, elections rarely changed the course of equity market trends, but 2016 changed this perception (call it a recency bias?) The surprise election of Donald Trump to the highest office, and the highly volatile night that followed in financial markets, have made traders wary of the event.
Betting markets for the US presidential election have tightened sharply in recent days, a development that could upset investors’ confidence in a clear, uncontested outcome. It’s also resurrected the possibility that Donald Trump gets another term. Of note - the betting odds reflect wagers made with real money and have often led the public opinion polls.
Public polls have tightened, too. The FiveThirtyEight average of all polls gives Biden a lead nationally of 9.9 percentage points, down from 10.7% a few days ago. That was, at the time, the widest spread in favor of the Democratic challenger since the race entered the home stretch post-summer.
At TOGGLE, we monitor asset behavior around important events (like elections) to keep investors appraised on the potential impact on their portfolios. Many assets often exhibit repeatable patterns around such events because emotions - greed and fear - might drive price action more than a re-assessment of fundamentals.
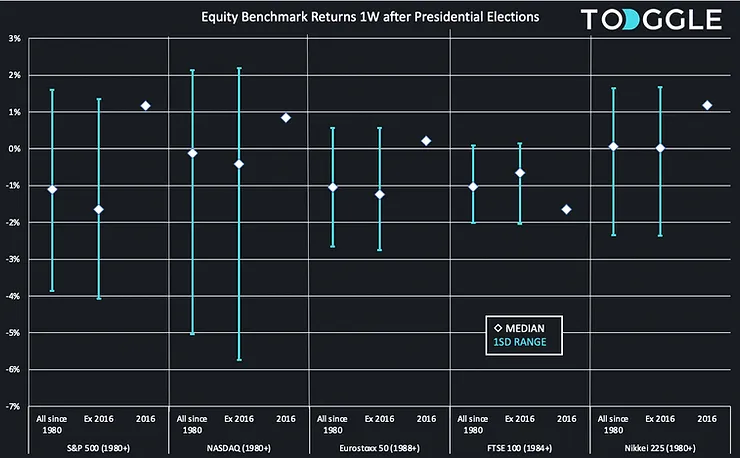
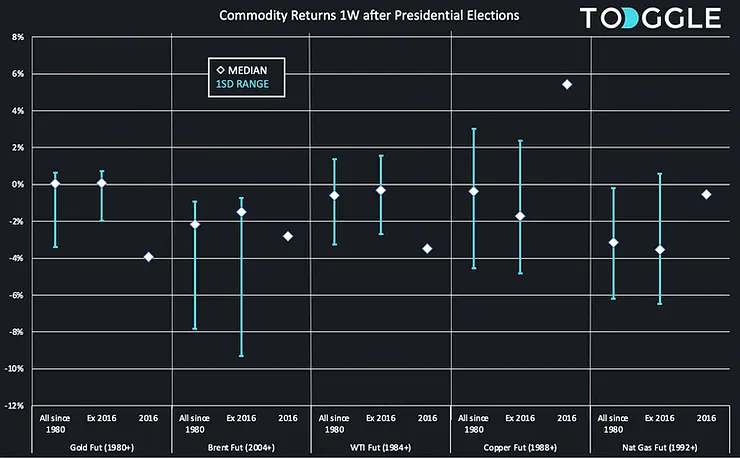
We analyzed the performance of a few key assets across different horizons after a presidential election going back to the 1980s. The results are split into three buckets: behavior around all elections, excluding the 2016 election, and only looking at the 2016 election. The latter bucket is interesting to study due to the specific nature of the surprise, and the continued relevance of this “surprise” in the upcoming election.
The first chart shows the performance of equity benchmarks: with the exception of the FTSE 100, every other benchmark studied performed better after the 2016 election relative to the baseline of all elections.
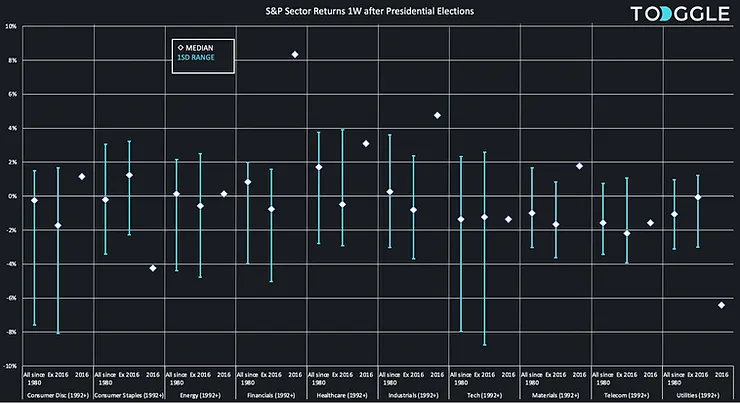
Among different S&P sectors, financials and industrials outperformed. The biggest losers were consumer staples and utilities.
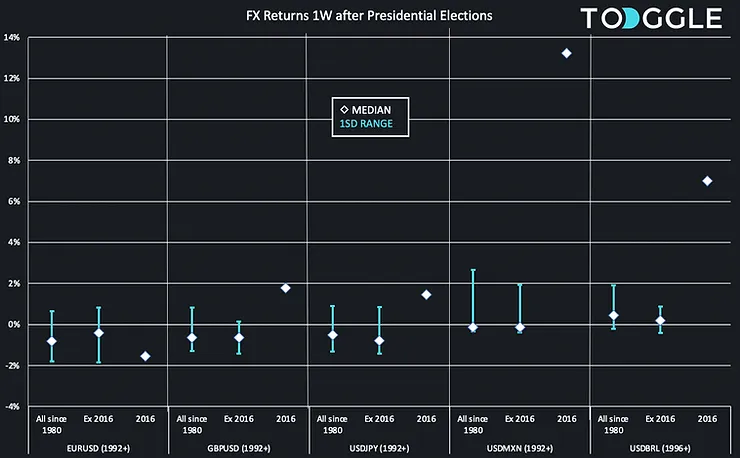
In currencies, Emerging markets were particularly impacted: USDMXN and USDBRL stand out as MXN and BRL both weakened considerably in the aftermath of the surprise outcome.
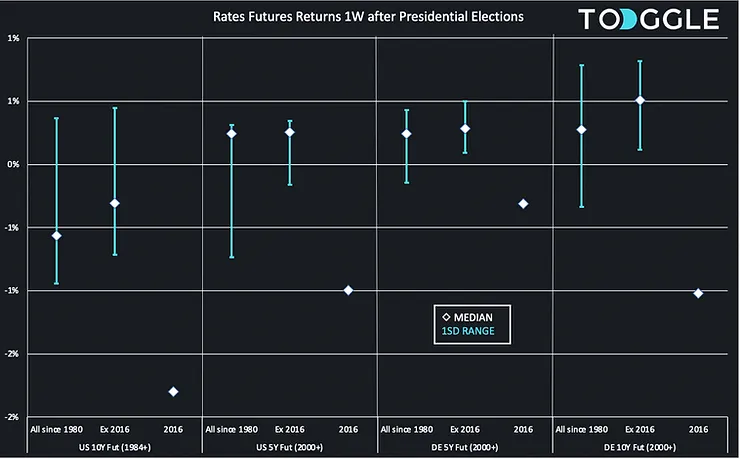
In rates, the biggest underperformer was the 10Y US Treasury future, while the impact in Europe was directionally similar, but smaller.
Finally, price action in commodities was more muted over this horizon, but there was a differentiation between copper and nat gas - both higher - compared to crude oil and gold which both ended lower.
Interested in digging further into financial outperformance? Check out the video.
Market movements around elections


Up Next
Dec 12
preview