
Dec 12
preview

When markets move fast, like current reactions to fears of a Coronavirus epidemic, data analysis often takes a backseat to intuition. Finding and cleaning the right data (not to mention analyzing it) can easily take enough time for another gapping move to happen before you’ve finished.
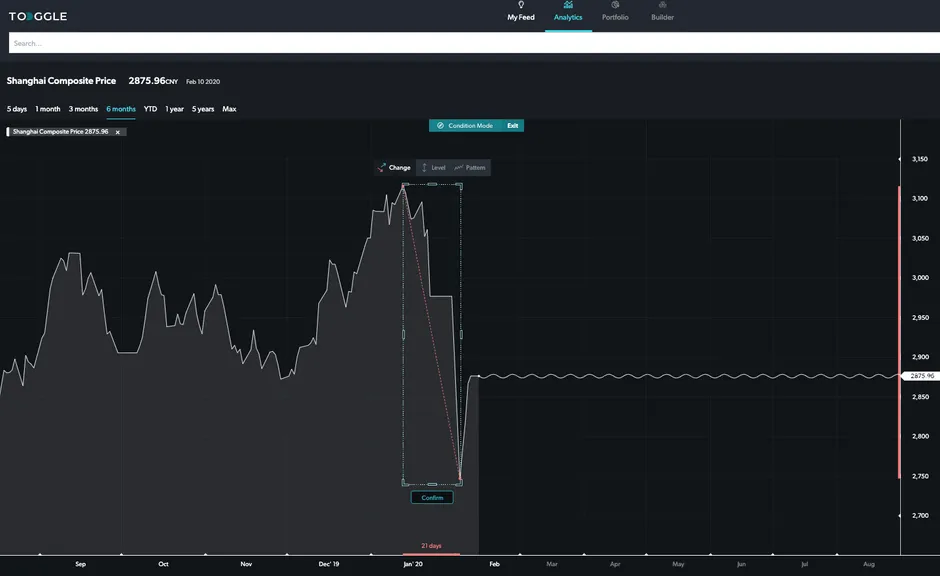
TOGGLE Compass is ideally suited for these situations. When Chinese markets re-opened after the holiday period, they recorded large drops in response to heightened fears of the spreading Coronavirus. Active traders use Compass to quickly dissect these price dynamics in just a few clicks.
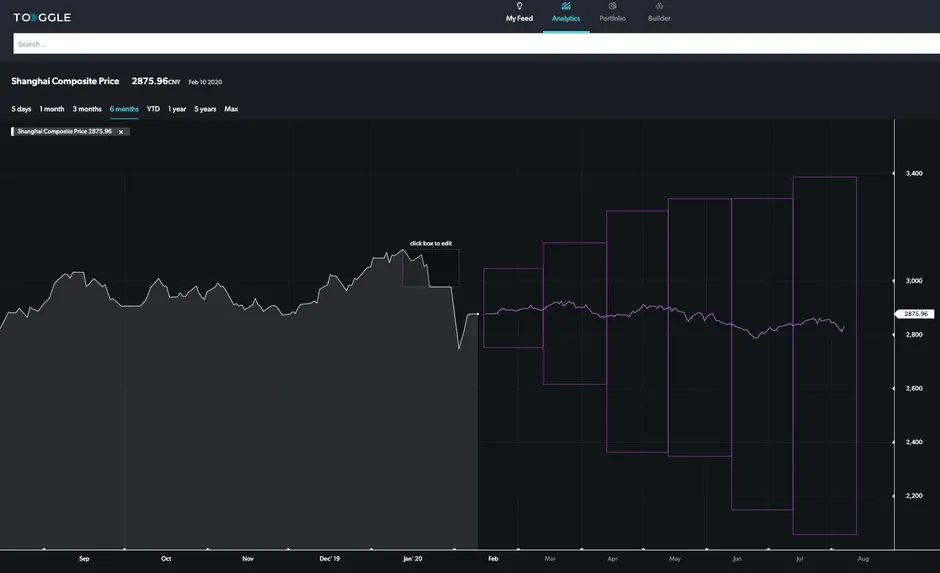
Below, you can see how Compass can be used to see if prior patterns of fast drops in SHCOMP provide any clues to how the market acted in the immediate period after. All that’s required is to highlight the relevant period. The results are instantaneous. TOGGLE displays the likely path over the following 6 months and the confidence interval around that path (each box is a month, and the height represents the confidence interval).
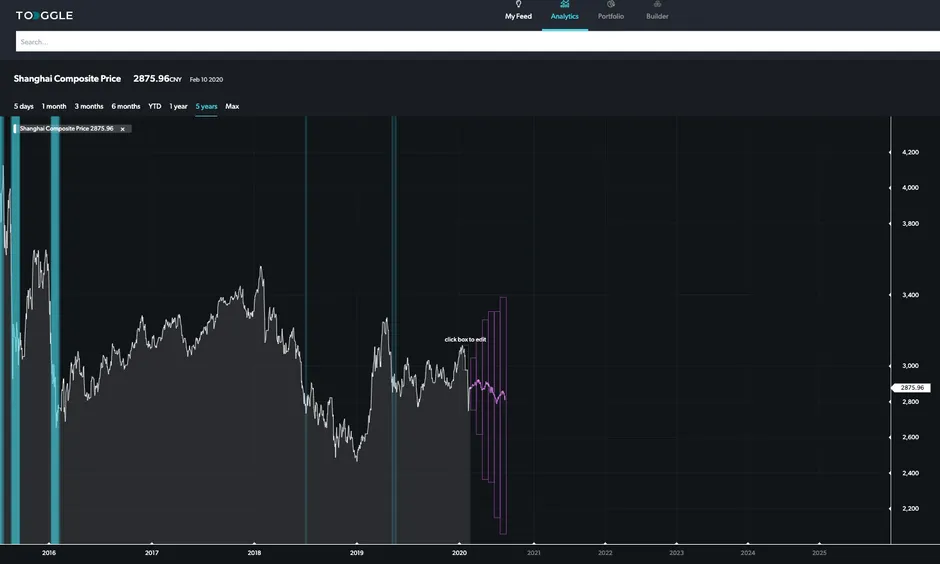
Want to see previous occurrences? Simply click to extend the horizon to 5 years of history and see the other times a drop like this has happened
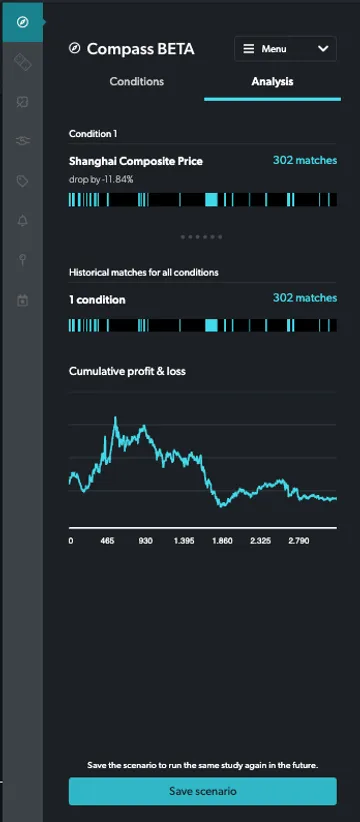
You’re also given information about the number of times we’ve seen such a drop before, and a hypothetical P&L from going long in the aftermath of every such similar sell-off. Unsurprisingly, it’s not compelling: buying after a drop like this hasn’t consistently been a good strategy.
Intuition and Data in Fast Markets: Chinese Coronavirus


Up Next
Dec 12
preview