
Dec 12
preview
Last week equity markets experienced a 3.5x standard deviation move. Whenever markets undergo large drawdowns, a majority of the investment community ponders the same two questions: should I buy the rebound?” and, “how did the market do the last time it fell this much?”
To get context, you can see below the market move in risk adjusted terms.
The chart displays S&P 500 drawdowns normalized by the level of market risk present up to the moment the drawdown began. This metric is interesting because it shows how smaller moves might take the market by surprise when they appear during quiet periods, leading to subsequent after-shocks.
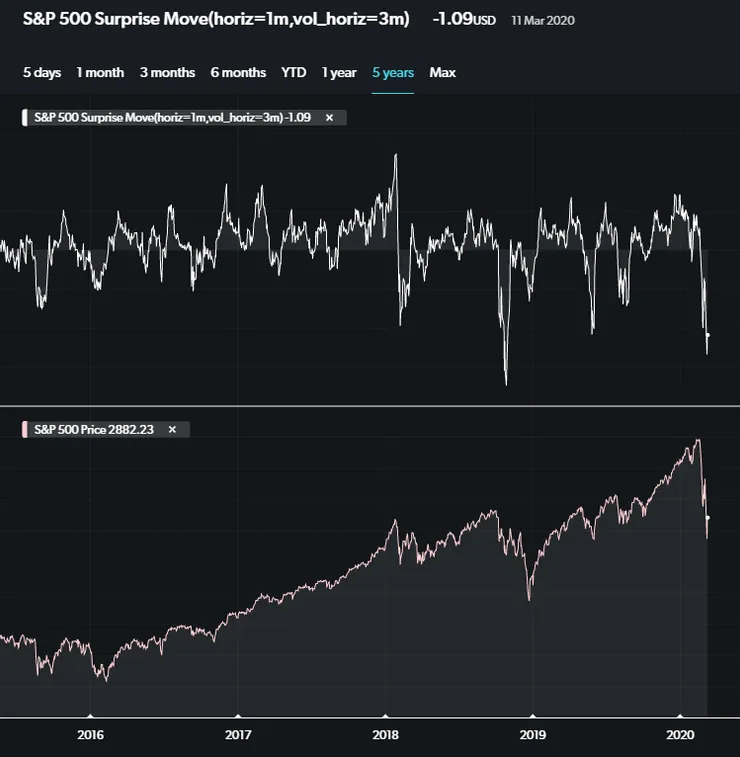
Moves as large as the recent one happened 10 times in the last 25 years, and in several of these cases, markets struggled to show an immediate rebound*.
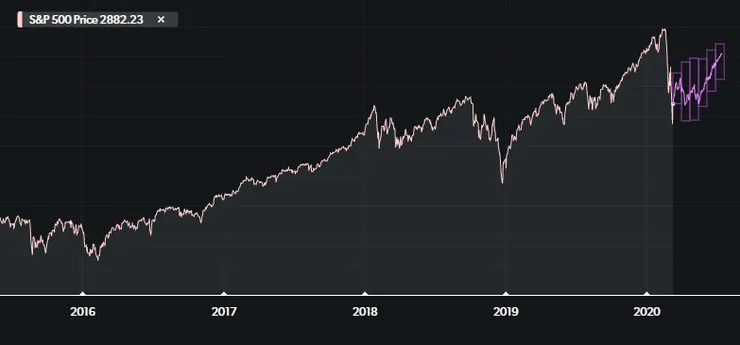
When we select the market performance, after similar drawdowns, we see that the outcomes can be quite varied and - if anything - they have a negative skew [1].
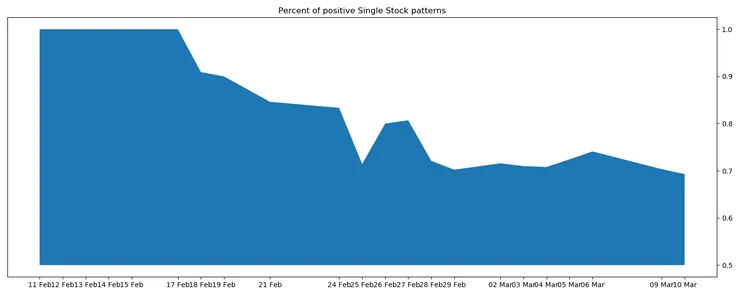
To complement this analysis, we took a bottom-up approach and aggregated all our single-name stock patterns for the US. With the knowledge that this average has a natural positive bias [2], it is interesting to note that the drastic drop starting on Monday, February 18th (a week before the onset of the drawdown) has not recovered in any measure and, if anything, single-name stocks still point to weakness.
The market is currently subject to a series of contingent pressures, most importantly including the coronavirus scare and the oil shock. The nature of price action after the drawdown offers a chance to test the likelihood that the bull market continues.
Subject to an abatement of the oil and coronavirus crises, we now have a clear path to follow for a rebound. If we were to diverge meaningfully from this path, we would start to question whether the continuation of the bull market is now in doubt.
[1] This is truly remarkable for S&P 500, because the post Great Financial Crisis bull market skews most analyses for S&P towards the bullish side. 2-4 months of flat performance is truly a remarkable finding.
[2] This is due to there being more periods of bull market than bear market, leading it to a higher number of positive signals in absolute terms
Equity Drawdown Offers Litmus Test for Bull Market


Up Next
Dec 12
preview